Sensing Change
A yearlong initiative exploring the interconnections between art, science, and our changing environment.
June 2013–July 2014
Sensing Change featured an exhibition highlighting the work of eight contemporary artists and interviews with nine scientists whose work intersects with issues surrounding climate change.
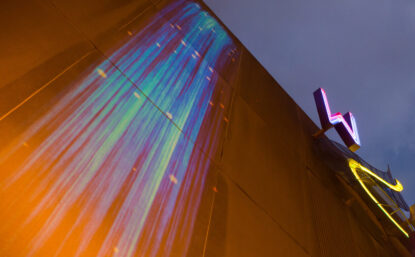
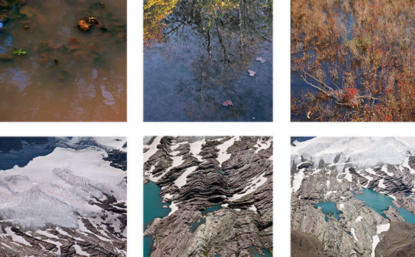
Art
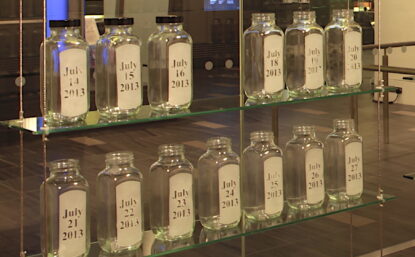
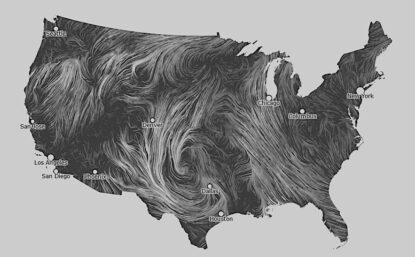
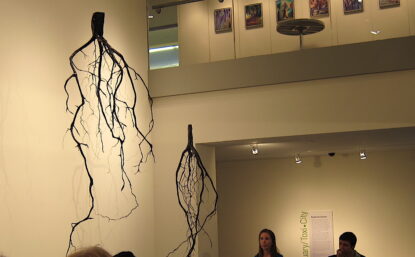
See our environment—its vitality and vulnerability—with fresh eyes. The work of eight contemporary artists in Sensing Change invites us to consider the local, global, and cultural implications of living in our changing world by presenting new visions of the threats, opportunities, and upheavals we face. Inspired by scientific investigation, historical accounts, and direct observation, the art in this exhibition explores not only daily shifts in our environment but also long-term climate change.
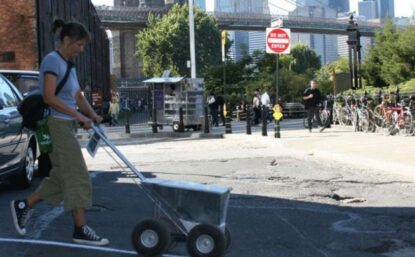
Hear the artists behind Sensing Change through video interviews and other media. See their studios and learn how artists work with scientific data and scientists to create art that responds to our changing climate.
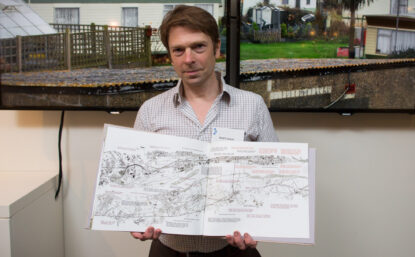
Scientists
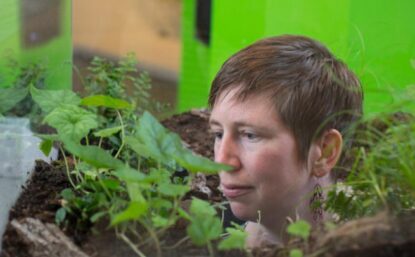
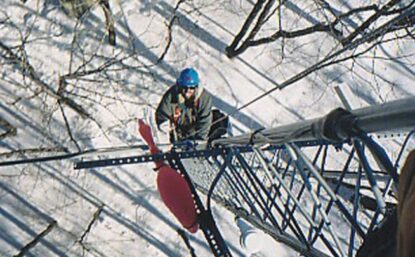
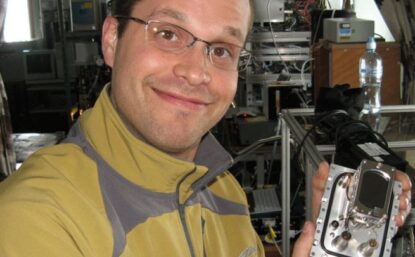
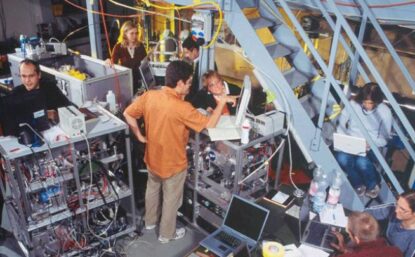
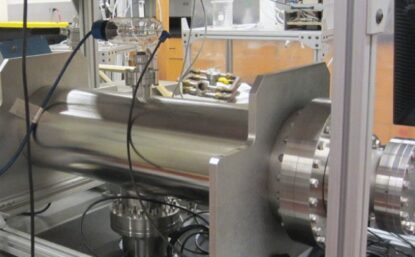
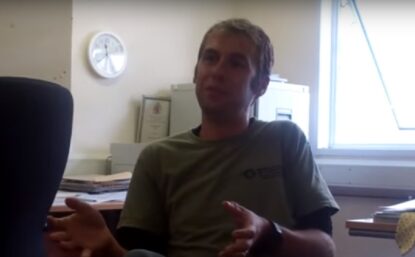
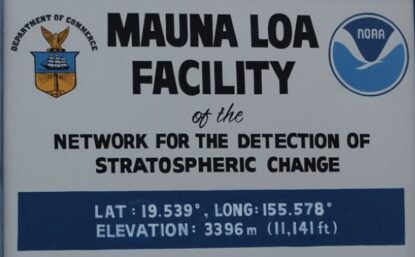
Our Center for Oral History sought scientists who devote their research to better understanding what makes up our air, how it has changed over time, and how it continues to change. This collaborative group of scientists spans the globe: from Antarctica to Hawaii, their field studies and air-monitoring techniques have shed new light on the worldwide state of the air. These investigators use, modify, and create instrumentation to gain an increasingly precise view of our atmosphere. Like the artists whose work appeared in Sensing Change, these scientists use a variety of techniques and data to gain new insight—and share with a broader public—how our climate is changing.
The scientists interviewed as part of this project explored not only the details of their lives and careers but also their thoughts on how scientific data might be communicated visually, the state of atmospheric research, and what the public should know—and do—about climate change.

Acknowledgements
Funders: John S. and James L. Knight Foundation, Dow Chemical Company, Public Health Fund, Daniel Dietrich Foundation, Crystal Trust, Pennsylvania Historical and Museum Commission, and U.S. Trust for companion programming and event sponsorship.
Community Partners: Air Management Services, Avenue of the Arts, Clean Air Council, Office of Arts, Culture and the Creative Economy, Philly Rising Collaborative, Post Brothers Real Estate, Schuylkill Center for Environmental Education, and Wilma Theater