Data is everywhere. It is hidden in something as small as a human protein and as large as Earth’s atmosphere. It lies in creatures both living and dead. Data has revealed the history of life and of Earth itself. But data doesn’t speak on its own; it must be interpreted by scientists. The question is, what do they do when there is just too much data to manage?
A thousand kilometers above Earth, protons and electrons whiz and spiral around in a layer of high-energy particles, trapped by our planet’s magnetic field. This blanket of ionized particles—called the Van Allen belt—was discovered in 1958, and immediately geophysicists began brainstorming ways to test the phenomenon. One idea sticks out from the rest: explode a nuclear bomb inside the belt. “Just to see what would happen,” quips Elena Aronova, a historian of science at the University of California, Santa Barbara.
Although this apocalyptic-sounding experiment never made it past the brainstorming phase, it wasn’t the only planetary hack proposed by Cold War scientists. At the time, weaponizing Earth and its environment was all the rage. Scientists floated ideas like melting polar ice caps with hydrogen bombs to drown an enemy’s coastal cities. In his book Arming Mother Nature historian of science Jacob Darwin Hamblin lists some of these schemes, including one that proposed using thermal radiation from a hydrogen bomb’s detonation to ignite forest fires as a way to decimate adversaries. Scientists and military strategists in the United States and the Soviet Union considered everything from biological weapons to weather control as strategies for wielding Mother Nature against human foes.
To learn enough about our own planet so as to militarize it, researchers needed to learn more about glaciology, geomagnetism, gravity, the ionosphere, and the world’s oceans. Yet at the time, scientists possessed only patchwork data about these subjects. Cold War–era secrecy precluded open exchange of basic information about the workings of Earth, beyond the sharing of sparse meteorological data. In the Soviet Union even seismological data was top secret, in part because it could be used to track nuclear testing. For this reason, Aronova says, Soviet scientists were banned from even mentioning the word earthquake in public, let alone releasing information about recent tremors or new fault lines.
Still, both sides craved earth-sciences data; so a curious deal was struck. In the wake of the successful Atoms for Peace program in the early 1950s, where the United States and the Soviet Union agreed to share some nuclear data, the two superpowers participated in a massive science project called the International Geophysical Year (IGY), which ran in 1957 and 1958. Scientists around the world acquired, shared, and disseminated vast swaths of data about weather, climate, the aurora borealis, solar flares, earthquakes, volcanic eruptions, and the planet’s magnetism.
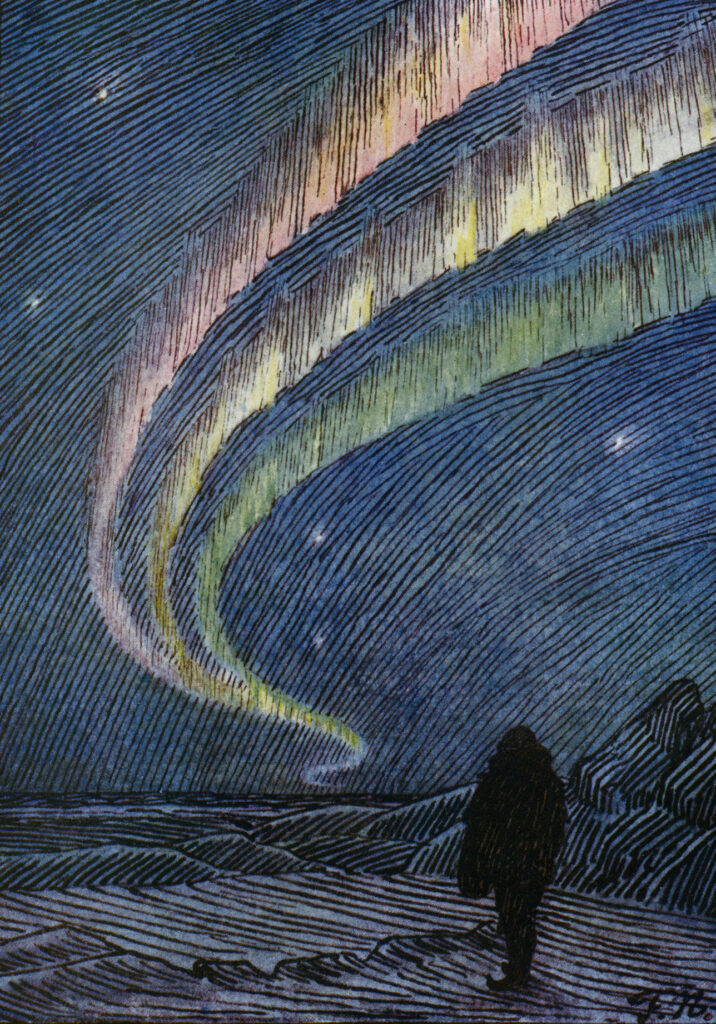
The aurora borealis, as drawn by Norwegian explorer and scientist Fridtjof Nansen.
The ambitious project involved thousands of researchers in 67 countries who set up observation stations around the globe to gather and then dispatch information to World Data Centers on both sides of the Iron Curtain. The Soviet Union and the United States launched satellites and rockets to collect data that would be shared among political archnemeses—as well as to verify the existence of those high-energy particles in the Van Allen belt.
The amount of data produced by these experiments was mind-bogglingly large. During the IGY project thousands of miles of microfilm, millions of data sheets, and hundreds of thousands of photographs were accumulated, dispatched, and archived. Planners at one IGY meteorological center considered using computers to store their data, until they estimated that doing so would require 50 million punch cards. Such a data set could hardly be sent by post around the world, Aronova says. In 1960 Alan Shapley, the vice chairman of the U.S. IGY national committee, described the IGY as a “big data collecting binge.”
Half a century later society as a whole is bingeing again on data. Governments, companies, and private citizens are compiling colossal amounts of information about everything: our body’s vital signs, customer buying trends, musical preferences, traffic patterns, migrating birds. Much of the discussion about this explosion of data collection makes it sound new or exotic. As it turns out, our urge to amass daunting amounts of information is far from a 21st-century phenomenon, or even a 20th-century one.
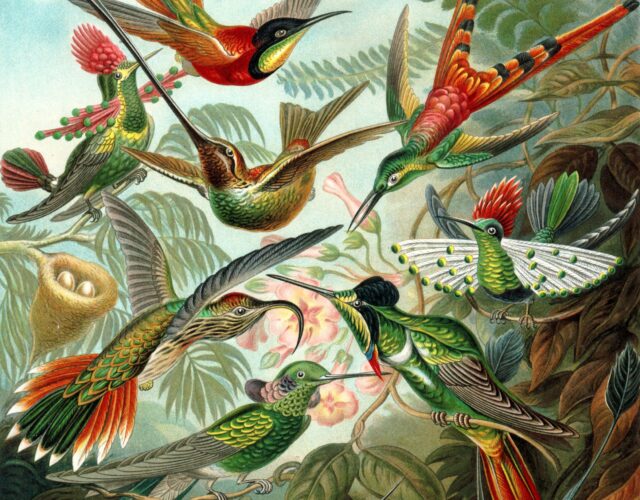
Motivated by the promise of discovery, prestige, and power, humans have been creating for millennia what today we’d call “big data.” Look no further than the still-preserved records of the 1st century CE census that tabulated the more than 13 million people living in Han Dynasty China. Or consider Johannes Kep-ler’s 1627 Rudolphine Tables, a comprehensive catalog of the position of more than a thousand stars observed by Tycho Brahe and other astronomers. Bruno Strasser, a big-data historian at the University of Geneva, points to a third example: the flooding of European natural-history collections with plants and animals when New World explorers returned home with exotic specimens that fit no known classification.
Throughout history people have thought the amount of data gathered in their era was unprecedented. And then as now, researchers pined for new technologies that could handle these onslaughts.
The primary differences between big-data projects of the present and the past are in the form the data takes and how it is put together, presented, and analyzed, says Staffan Müller-Wille, a historian of big data at the University of Exeter. Previous generations amassed vast collections of rocks, papers, photographs, microfilm, punch cards, dried plants, stuffed birds. Now big data is digital: it’s measured in exabytes, zettabytes, and yottabytes, or 1018, 1021, and 1024 bytes, respectively. Compared with that of previous generations, today’s big data may well be bigger by absolute measures. But data, like currency, is subject to inflation. The thousands of miles of microfilm produced by Cold War geophysicists during IGY might fit easily on a modern-day hard drive, but those scientists were just as daunted by the torrents of information they faced as we are today by the zettabytes compiled by NASA, Facebook, or Amazon.
“Big” is relative; so historians of science and technology identify big-data projects of the past by the reaction of researchers to the flood of information being collected and crunched. These historians employ such criteria as whether scientists feel overwhelmed by the data’s magnitude or whether they need to develop new technologies to tame the information and capitalize on its promise.
Under this lens the ability of molecular biologists to sequence the trillions of microbes living in an individual’s body and then use that data to predict whether he or she is likely to suffer from irritable bowel syndrome is no less notable than Carl Linnaeus’s success in 18th-century Sweden. Linnaeus, in hunting for plants that could be grown in the chilly Swedish climes, tabulated into coherent, organized groups tens of thousands of new plant species brought to Europe from the New World and other exotic locales, and in doing so he invented modern taxonomy.
Although attempts to organize nature in logical lists go back to antiquity—the Roman scholar Pliny tried his hand at grouping living things in the 1st century CE—Müller-Wille says systematic attempts to catalog species began in earnest during the late Renaissance.
Linnaeus became a human clearinghouse of botanical information—a one-man, 18th-century, crowdsourced human Wikipedia about the natural world.
When Linnaeus got into the game, his first achievement was to narrow the number of known plant species to about 3,000 from the 16,000 described by John Ray, then one of the most important naturalists in the world. To whittle down the list and remove redundancies, Linnaeus plowed through all the existing literature: thousands, possibly tens of thousands, of pages.
Newly discovered plants were first organized in Linnaeus’s 1735 tome Systema Naturae, or, more wordily, System of Nature through the Three Kingdoms of Nature, According to Classes, Orders, Genera and Species, with Characters, Differences, Synonyms, Places. The book was an immediate success. “People read it, noticed that certain species weren’t included that they personally knew of, or they saw misidentifications, and so they sent him specimens,” says Müller-Wille. Linnaeus became a human clearinghouse of botanical information—a one-man, 18th-century, crowdsourced human Wikipedia about the natural world, empowered by an international troupe of diligent editors.
Linnaeus poured this feedback into Systema Naturae, producing one edition after the other. The book grew with each edition—the number of plant species eventually hit about 5,000—and with each publication the crowdsourcing worked better. Naturalists around the world came to realize, says Müller-Wille, “that if they wanted to be acknowledged for the discovery of a new species, it had to go through Linnaeus and it had to be published in Systema Naturae.”
In 1766, when Systema Naturae was in its 12th edition, Linnaeus reached information overload. The naturalist was receiving too much correspondence and too many specimens from around the world, particularly the Americas. His students were traveling to Asia and Africa and bringing back their own specimens as well.
To cope with the glut of data and tease out original insights about the history of life, Linnaeus turned to a hot new tool for data management: index cards. At the time, index cards were a relatively recent innovation used primarily by banks and bureaucrats; they weren’t adopted by libraries until later in the 18th century. Linnaeus was one of the first scientists—if not the first scientist—to employ index cards as a data-management tool.
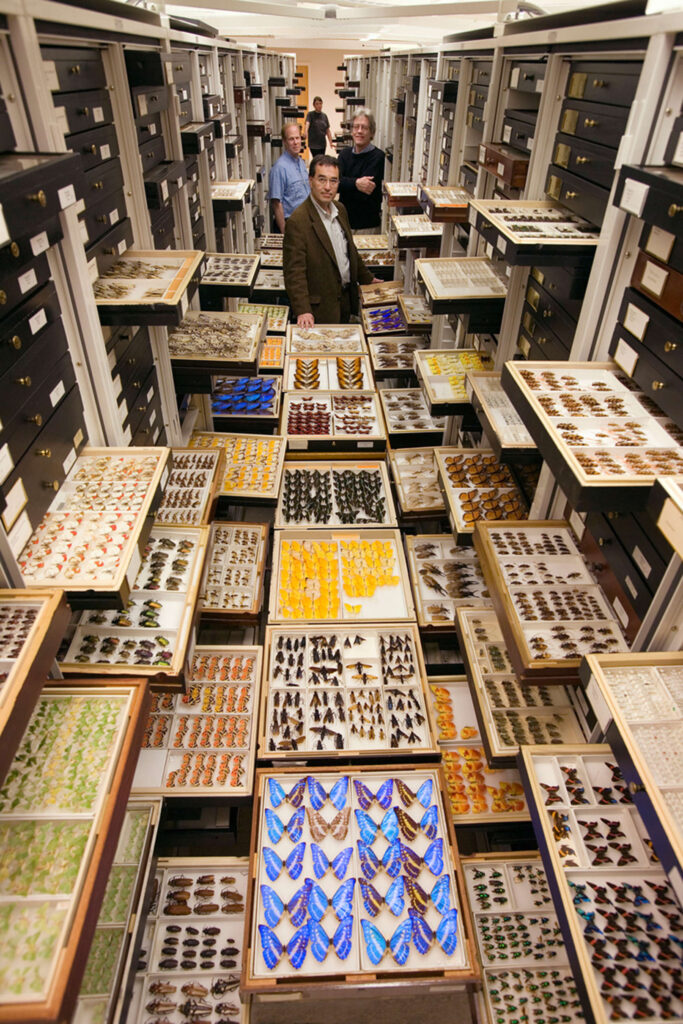
The archives of the Smithsonian National Museum of Natural History’s entomology department.
With the help of the cards, which were great for arranging and rearranging species into groups, Linnaeus’s classifications and analysis of all the known species revealed an important evolutionary fact: some genera and families have very few species, while others are hugely diverse.
We now know that the reason for this lies in extinction and in the failure of some species to evolve in the face of new environmental challenges. But in Linnaeus’s time this irregular distribution flew in the face of widespread beliefs about nature’s order that had been held for more than 2,000 years. Scholars had long argued for the existence of a visible plan in nature, some kind of well-constructed organization to life. The efforts of Linnaeus and the naturalists who followed went against creationist intuitions, shattering ideas that nature was shaped by a divine creator who put every species in its special place.
Linnaeus’s ability to manage one of his era’s biggest data problems made him famous—and not just to scientists. He was called the “Prince of Botanists” by his fans; even the German poet Johann Wolfgang von Goethe said of Linnaeus, “With the exception of Shakespeare and Spinoza, I know no one among the no longer living who has influenced me more strongly.” Even today Linnaeus remains venerated. In 2014 an analysis of English Wikipedia ranked Linnaeus as the third most important figure in the online encyclopedia, after Napoleon and Barack Obama.
Using the then newfangled index cards was a key to Linnaeus’s success: the technology allowed him to manipulate information, to analyze it. While Linnaeus borrowed a new technology from banking and applied it to his own research problems, other scientists have had to devise entirely new tools to crunch their big data.
Take, for instance, the 19th-century German paleontologist Heinrich Bronn. Like Linnaeus, he witnessed an explosion of data in his field. But instead of trying to wade through a deluge of new plant specimens, Bronn wanted to make sense of the overabundance of fossil records stored at museums, universities, and archives around Europe.
At the time, there was a growing public and academic fascination with geology: fossils of strange creatures that no longer roamed Earth implied the idea of deep time, that the world was much older than expected. Geology’s founding father from the 18th century, James Hutton, famously remarked that Earth had “no vestige of a beginning, no prospect of an end.” This emerging worldview had unsettling religious implications—it certainly did not bolster creationism—and it laid part of the bedrock for Darwin’s theory of evolution.
One of the sexy new research fields in 19th-century geology was stratigraphy, the study of layers of sediment, or strata. Rocks in England could be compared with and correlated to those in Germany by associating similar layers of strata present in the different rocks. Stratigraphers like Bronn could compare fossils found in corresponding rock layers across Europe and argue that creatures found in these layers had existed within the same era. Going further, these early paleontologists could also start assessing the longevity of a species by counting the number of strata hosting the species’ fossils.
These first stratigraphers began organizing their findings in regional fossil collections, publishing catalogs—some containing elaborate drawings—of fossils found in different layers of sedimentary rock in a certain area. Bronn believed that if he made a master compendium of all the fossil compendia scattered across Europe, he might learn something new about the global fossil record—and so he did.
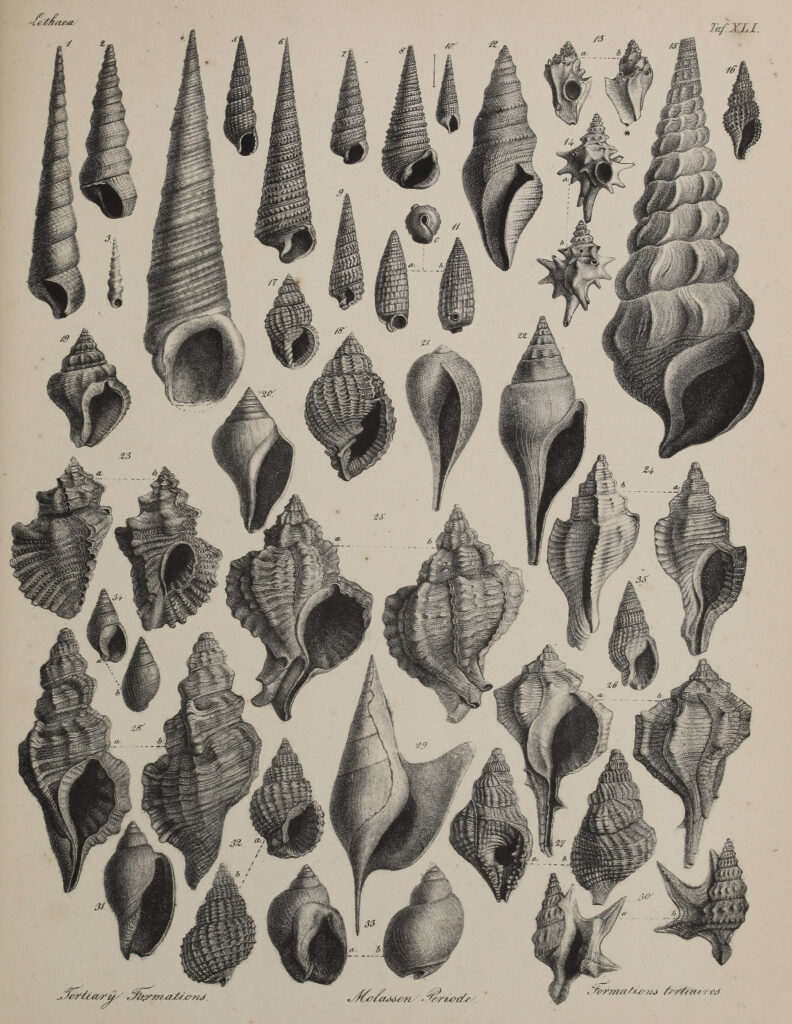
Fossils sketched and categorized by Heinrich Bronn for his book Lethäa Geognostica (1837).
In 1840 he assembled a 2,000-page table listing fossil species—mostly sea creatures like clams, snails, nautiluses, and trilobites—in taxonomic order, along with where the fossil had been found and in what stratigraphic layer. Bronn then converted this information into numerical data and analyzed it in a variety of ways, using basic statistics.
Bronn could only make an educated guess at how old the different strata (and fossils therein) were in terms of absolute time: estimates ranged from many billions of years to just millions of years, a detail that would only be resolved definitively by the development of radiocarbon dating in the 20th century. But Bronn’s comparisons and analytic work allowed him to discover that particular types of species lasted longer in the history of life, says David Sepkoski of the Max Planck Institute for the History of Science.
For example, Bronn noticed that ammonites—an ancient group of marine creatures with a shell that looks like a tightly coiled ram horn and that varied in length from 5 feet long to just a few inches—suddenly disappeared in the fossil record. Meanwhile other ancient mollusks found in the deep past were virtually indistinguishable from present-era specimens.
In the end Bronn’s graphical illustrations of biological diversity patterns, derived from his analyses were, Sepkoski says, “amazingly almost identical to ones that were produced 150 years later with the aid of computers and more powerful statistics.”
Like many modern big-data projects, Bronn realized that the trick to ordering chaos was to find a way to visualize information and in doing so learn something from it.
If any big data–producing endeavor has benefited from rendering complex information into something seeable, it’s in the field of structural biology. This field zooms in on the tiniest of biological machines: the proteins responsible for pumping nutrients into our cells, copying and separating our DNA during cell division, breaking down our food, or trafficking neurotransmitters along the axon of a neuron. Structural biologists deliver detailed three-dimensional coordinates for all the atoms found in the protein machines, schematics that underpin the mechanism of life itself.
Having this blueprint enabled scientists to reverse-engineer these machines, to understand how they work and how their malfunction results in disease. For example, by having the blueprint of myoglobin and hemoglobin, researchers could see the locations in these proteins responsible for clutching oxygen. Scientists could also see that carbon monoxide might kick out oxygen and take its place, thereby starving the body’s tissues of oxygen, revealing why carbon monoxide is so toxic to humans.
In the late 1950s John Kendrew and Max Perutz used X-ray crystallography and paper-tape computers to produce the very first three-dimensional, atomic-level blueprints of myoglobin and hemoglobin, tiny proteins composed of hundreds of amino acids and thousands of atoms. X-ray crystallography had already been used to discover the three-dimensional structure of DNA: researchers hit the molecule with X-rays and then measured the rays’ diffraction pattern. Proteins, however, are orders of magnitude more difficult to analyze than DNA because of the complex ways they fold. The computers of the day didn’t have the processing power to produce visualizations of these oxygen-carrying proteins. Instead they spat out reams of paper tape with holes punched into them. The patterns of punches were translated into numbers, which in turn gave the coordinates for each atom’s electron density, a proxy for the position of the electrons’ atom, says Purdue University’s Michael Rossmann, who wrote the computer program as a postdoctoral fellow in Perutz’s lab. But to learn how these protein machines worked, structural biologists needed to see more than a list of computer-generated numbers.
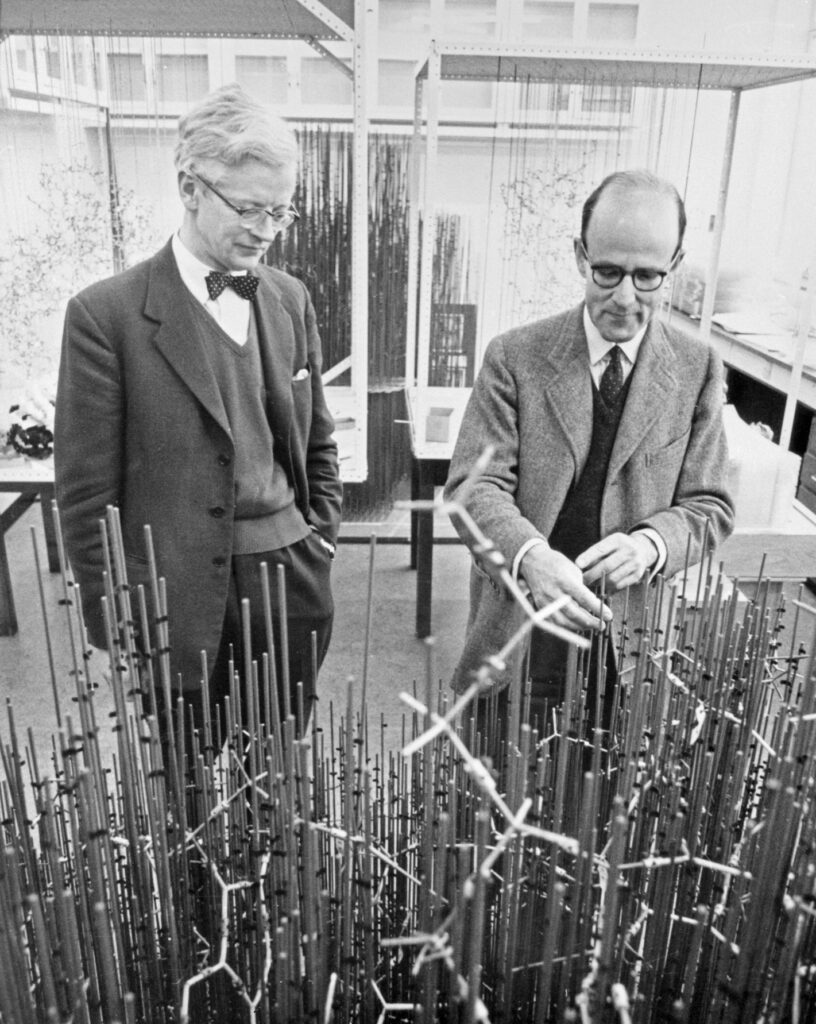
John Kendrew and Max Perutz with the “forest of rods” model of myoglobin, ca. 1960s.
Initially, structural biologists turned to artists or developed the skills themselves to visualize the big data inherent in protein structures. Low-tech, bare-bones solutions included wood reconstructions and watercolor paintings that approximated the shapes and important atomic features of these proteins. Accurate ball-and-stick models containing thousands of atoms were far more challenging to create but were more useful as representations. They could take months to produce by hand, says Ian A. Wilson, a pioneering structural biologist at the Scripps Research Institute in California.
To build ball-and-stick models researchers plotted two-dimensional sections of the protein’s electron-density data onto transparent plastic sheets: imagine two-dimensional topological representations of a complex terrain, such as mountain ranges. By stacking these plastic sheets they created a three-dimensional representation of the protein’s electron density, from which they painstakingly constructed ball-and-stick atomic models of the protein using wires and screws. To align the models with the electron-density maps, the scientist built a contraption called a Richards box. Designed by Oxford University’s Frederic M. Richards in 1968, the device used half-silvered mirrors to superimpose the atomic models being built with the electron-density maps.
Once the scientist was done building the model, he or she began the exhausting process of figuring out the three-dimensional coordinates of the protein. Before computer graphics this task required rulers and plumb lines. By the mid-1970s computer-graphic technology was good enough to create visualizations of proteins on screen.
Yet scientists’ earlier labors of love bequeathed results. Those low-tech visualizations allowed structural biologists to uncover common topological features in proteins, such as α-helices, similar to the shape of DNA. They also revealed that nature recycled certain topologies for biological purposes as diverse as nutrient breakdown and DNA replication. Nature’s recycling of these useful shapes can be compared with using small-scale versions of wheels, levers, or pulleys to perform many different tasks.
In the 1960s, the same decade in which structural biologists first grappled with ways to visualize their big data, geophysicists struggled to make sense of the masses of data coming out of the IGY project. “Now is the time to ensure that present and future data do not overwhelm us,” wrote meteorologist Marshall Jamison, “but rather are acquired, screened, processed, and distributed through structures designed for maximum economy and usefulness.”
Some important discoveries are rooted in IGY research—including the famous Keeling curve, a time plot of increasing atmospheric CO2 concentration that provided essential evidence that humans were significantly changing the global environment. But as the American IGY committee bemoaned in 1960, the “sheer scope and size of the monumental body of data” stymied those trying to extract value from it.
As modern big-data projects save every photo, every sneeze, every e-mail, every experiment, every GPS coordinate, every online transaction, indeed, every everything, will modern data bingers find themselves dealing with a case of digital heartburn?
The data stored at the IGY World Data Centers was idealized as a treasure chest of information, “but the keys to that treasure chest turned out to be missing,” says historian Aronova. “Only a small part of the data-holdings was ever used or even processed.” The tools to capitalize completely on the data’s promise did not yet exist.
Part of the problem was that much of the IGY data was stored on microfilm. Choosing the right storage platform, as any archivist will tell you, is essential to preserving data and making it usable to future generations. Aronova says that in the 1950s and early 1960s microfilm had information retrieval and searching capabilities comparable to those of computers. But soon computers began to surge ahead, hastening analog’s decline and digital’s dominance. Microfilm’s demise also spells doom for the data stored on it. Depending on storage conditions, the plastic in microfilm can begin degrading after several decades, damning the data stored on the polymer to oblivion.
Another reason the promise in all that IGY data remains unrealized is due to the data’s dissimilarity. For example, data dispatched from the IGY aurora-borealis experiments consisted of photographs, spectrograms, maps, observation logs, tables, charts, documentary films, technical reports, and scientific publications. The multiple platforms and the incompatibility of data from different platforms made it challenging to process, says Aronova. There was simply too much IGY data, on too many platforms, to allow successful exploitation of all of its promise.
Should today’s data fetishists see the IGY’s data overindulgence as a cautionary tale? As modern big-data projects save every photo, every sneeze, every e-mail, every experiment, every GPS coordinate, every online transaction, indeed, every everything—just in case it might one day be useful—will modern data bingers find themselves dealing with a case of digital heartburn? Will possible epiphanies get drowned out by noise? Or will the mere fact that the data is digital, and thus more easily manipulated, shared, stored, and searched, be a saving grace?
“Producing and saving a huge amount of data that nobody will reuse has doubtful value,” argues Strasser. “Half of publications are never cited, and it’s the same thing with data.” One way to make sure accrued information is reusable is to put effort into saving the right metadata. So, for example, in the case of a project designed to map gut micro-biomes in humans, researchers should not only save a list of DNA bases found in each subject’s gut microbiome but should also note whether the donor was healthy or had irritable bowel syndrome, for example, and the donor’s age and sex. This metadata makes the original details far more useful for answering future research questions. But how should we collect this metadata intelligently and in useful moderation when we don’t even know what research questions will be interesting to future generations of scientists?
To answer this question, Strasser says, modern data curators may wish to learn from the classical collectors: natural-history museums.
Such museums, says Strasser, have collected worthwhile data and, in imagining its future use, have acted as good database managers. Consider the collections in Berkeley, California, at the Museum of Vertebrate Zoology. “They have these incredible collections of organisms taken during field trips in the 1910s in the Sierras that are being reused today to look at the impact of global warming on vertebrates. Just because the exact right amount of metadata was acquired at the time—the altitude, the temperature—their collections can be used today to answer a climate question that people in 1910 couldn’t have cared less about.”
In this 21st-century digital world, with its overabundance of information, managers and creators of big data may find their inspiration in the most analog of collections.